はじめに
こんにちは.あけましておめでとうございます.今年は自作プログラムの天体画像処理機能を充実させたいという思いがあったので,年末から三が日にかけて,少しだけ進めていました.
やっていくぞ
まだ特に「天体写真の画像処理用途」の機能を実装していなかった私の研究用プログラムということで,初回である今回の目標は
- (複数の)Raw 画像を読込み
- 位置合わせなしコンポジット(平均値,中央値,分散,標準偏差などの統計値計算)
- (主にダークデータの)ノイズ解析用 scatterplots 生成
となります.特にノイズ解析ではあぷらなーとさんがよくダークデータのノイズ解析をしてらっしゃいますので,あんな感じのことができればいいかなということになります.
プログラムの全般的な詳しい機能の紹介は,以前書いたコンセプトの記事をご覧ください.
その1. Rawを開く(ファイルパス群→三次元データ)
まず,Raw を開くだけなら簡単です.以前紹介した rawloader crate を使用すれば開けます.
が,今回はコンポジットやノイズ解析をしたいので,複数枚の Raw 画像を読む必要があります.
これまでは一つの Path というノードで単一のデータファイルパスを表現していましたが,これを一つのノードで複数枚のリストが表現できるように改造する必要がありました.
これからコードをドバドバ貼っていきますが,自分のメモ代わりなので読み飛ばしてください.
pub enum PATHS {
    Nothing,
    FileList(Vec<PathBuf>),
}
impl MenuBar for PATHS {
    fn visualize<F>(&self, ctx: OutputWindowCtx<'_, '_, '_, '_, '_, '_, '_, F>)
    where
        F: glium::backend::Facade,
    {
        ctx.ui.text_wrapped(&im_str!("{:?}", self));
    }
    /*省略*/
}
IOValue::Paths(ref file) => {
    match file {
        primitives::PATHS::Nothing => None,
        primitives::PATHS::FileList(file) => {
            if read_only {
                None
            } else {
                let size = ui.item_rect_size();
                let mut ret = Ok(None);
                ChildWindow::new(im_str!("edit"))
                    .size([size[0].max(400.0), 150.0])
                    .horizontal_scrollbar(true)
                    .build(ui, || {
                        let mut hoge = false;
                        ret = ui.file_explorer(
                            TOP_FOLDER,
                            &[
                                "fits", "fit", "fts", "cr2", "CR2", "RW2", "rw2", "nef", "NEF",
                            ],
                            &mut hoge,
                        );
                    });
                ui.text(im_str!("Selected Files:"));
                for single_file in file {
                    ui.text(single_file.to_str().unwrap_or("Unrepresentable path"));
                }
                if let Ok(Some(new_file)) = ret {
                    let mut already_exist = false;
                    let mut key = 0;
                    for single_file in file {
                        if *single_file == new_file {
                            already_exist = true;
                            break;
                        }
                        key += 1;
                    }
                    if already_exist {
                        let mut new_files = file.clone();
                        new_files.remove(key);
                        Some(IOValue::Paths(primitives::PATHS::FileList(
                            new_files.to_vec(),
                        )))
                    } else {
                        let mut new_files = file.clone();
                        new_files.push(new_file);
                        Some(IOValue::Paths(primitives::PATHS::FileList(
                            new_files.to_vec(),
                        )))
                    }
                } else {
                    None
                }
            }
        }
    }
}
するとこんな感じに↓
なんかカレントディレクトリの表示がおかしいですが,ちゃんと動作するので今はキニシナイ.
次に,この Path 改め Paths を受け取り,画像を展開して**三次元データ(0番目の軸で何枚目かというインデックス,1番目と2番目の軸で画像の輝度にアクセスできる)**を生成するノードを作ります.
cake_transform!(
    "Open RAW file from a Paths.",
    0, 1, 0,
    open_raw<IOValue, IOErr>(path: Paths, n: Integer = 0) -> Image {
        if let PATHS::FileList(path) = path {
            vec![run_open_raw(path.to_vec(), *n)]
        } else {
            vec![] //エラーを返そう
        }
    }
),

fn run_open_raw<P: AsRef<Path>>(path: Vec<P>, n: i64) -> Result<IOValue, IOErr> {
    let pathlist_len = path.len();
    let n = n as usize;
    precheck!(pathlist_len > n)?;
    let mut imagecount = 0;
    let mut width = 0;
    let mut height = 0;
    let mut img = Vec::new();
    let mut openresult: Result<IOValue, IOErr> = Ok(IOValue::Integer(0));
    for single_path in path {
        let image = rawloader::decode_file(single_path);
        match image {
            Ok(image) => {
                if imagecount == 0 {
                    width = image.width;
                    height = image.height;
                } else if width != image.width || height != image.height {
                    eprintln!("Couldn't load images with different size images.\n"); //エラーを返そう
                    break;
                }
                if let rawloader::RawImageData::Integer(data) = image.data {
                    for pix in data {
                        img.push(pix as f32);
                    }
                } else {
                    eprintln!("Don't know how to process non-integer raw files"); //エラーを返そう
                    break;
                }
            }
            Err(err) => openresult = Err(IOErr::RawLoaderError(format!("{:?}", err))),
        }
        imagecount += 1;
    }
    match openresult {
        Ok(_) => {
            let img = Array::from_shape_vec((pathlist_len, height, width), img).unwrap();
            Ok(IOValue::Image(WcsArray::from_array(Dimensioned::new(
                img.into_dyn(),
                Unit::None,
            ))))
        }
        Err(_) => openresult,
    }
}cake_transform!マクロは,ノードを作るためのマクロです.引数で入力の型を指定し,->以降に出力の型を指定します.複数のデータを出力することも可能です.実際のデータは,Vec<Result<IOValue, IOErr>> という型のベクタで返しています.
i番目の画像をスライスして取り出して表示できています.
これで統計値計算への準備が整いましたので,このタイミングであぷらなーとさんに連絡をし,Nikon D3 と D810A のダークデータをいただきました(妥当性の検証ができるのはとても助かります,ありがたいです).とりあえず D3 のダーク Raw データが開けそうなので,こちらを使っていきます.
その2. 統計値計算(三次元データ→二次元データ)
三次元データを生成したら,各種統計値を計算するノードを作っていきます.平均はすでに実装済みでしたし,分散と標準偏差も使っている ndarray ライブラリに計算するための関数があります.中央値だけは,こちらで実装する必要がありそうだったので用意.
cake_transform!(
    "Average for Image. Parameters: a=start, b=end (a <= b).
Compute (Sum[k, {a, b}]image[k]) / (b - a). image[k] is k-th slice of image.
Second output contains (a + b) / 2
Third output contains (b - a)
Note: indices for a and b start from 0",
    1, 0, 0,
    average<IOValue, IOErr>(image: Image, start: Integer = 0, end: Integer = 1) -> Image, Float, Float {
        let middle = (*start as f32 + *end as f32) / 2.0;
        let width = *end as f32 - *start as f32;
        vec![run_average(image, *start, *end), Ok(IOValue::Float(middle)), Ok(IOValue::Float(width))]
    }
),
cake_transform!(
    "Variance for Image. Parameters: a=start, b=end (a <= b).",
    1, 0, 0,
    variance<IOValue, IOErr>(image: Image, start: Integer = 0, end: Integer = 1) -> Image{
        vec![run_variance(image, *start, *end)]
    }
),
cake_transform!(
    "Stddev for Image. Parameters: a=start, b=end (a <= b).",
    1, 0, 0,
    stddev<IOValue, IOErr>(image: Image, start: Integer = 0, end: Integer = 1) -> Image{
        vec![run_stddev(image, *start, *end)]
    }
),
cake_transform!(
    "Median for Image. Parameters: a=start, b=end (a <= b).",
    1, 0, 0,
    median<IOValue, IOErr>(image: Image, start: Integer = 0, end: Integer = 1) -> Image{
        vec![run_median(image, *start, *end)]
    }
),

fn reduce_array_slice<F>(image: &WcsArray, start: i64, end: i64, f: F) -> Result<IOValue, IOErr>
where
    F: Fn(&ArrayViewD<f32>) -> ArrayD<f32>,
{
    let start = try_into_unsigned!(start)?;
    let end = try_into_unsigned!(end)?;
    is_sliceable!(image, start, end)?;

    let image_val = image.scalar();

    let slices = image_val.slice_axis(Axis(0), Slice::from(start..end));
    let raw = f(&slices);
    let ndim = raw.ndim();

    let wrap_with_unit = image.make_slice(
        &(0..ndim).map(|i| (i, 0.0, 1.0)).collect::<Vec<_>>(),
        image.array().with_new_value(raw),
    );

    Ok(IOValue::Image(wrap_with_unit))
}

fn run_average(image: &WcsArray, start: i64, end: i64) -> Result<IOValue, IOErr> {
    reduce_array_slice(image, start, end, |slices| slices.mean_axis(Axis(0)))
}

fn run_variance(image: &WcsArray, start: i64, end: i64) -> Result<IOValue, IOErr> {
    reduce_array_slice(image, start, end, |slices| slices.var_axis(Axis(0), 1.0))
}

fn run_stddev(image: &WcsArray, start: i64, end: i64) -> Result<IOValue, IOErr> {
    reduce_array_slice(image, start, end, |slices| slices.std_axis(Axis(0), 1.0))
}

fn run_median(image: &WcsArray, start: i64, end: i64) -> Result<IOValue, IOErr> {
    let start = try_into_unsigned!(start)?;
    let end = try_into_unsigned!(end)?;
    is_sliceable!(image, start, end)?;

    let image_val = image.scalar();

    let slices = image_val.slice_axis(Axis(0), Slice::from(start..end));
    let dim = slices.dim();
    let size = dim.as_array_view();
    let new_size: Vec<_> = size.iter().skip(1).cloned().collect();

    let result = ArrayD::from_shape_fn(new_size, |index| {
        let mut vals = Vec::new();
        for (_, slice) in slices.axis_iter(Axis(0)).enumerate() {
            vals.push(slice[&index]);
        }
        //consider NaN!
        vals.sort_by(|a, b| a.partial_cmp(b).unwrap());
        let n = vals.len();
        if n % 2 == 1 {
            vals[(n - 1) / 2]
        } else {
            (vals[n / 2] + vals[n / 2 - 1]) / 2.0
        }
    });

    Ok(IOValue::Image(WcsArray::from_array(Dimensioned::new(
        result,
        Unit::None,
    ))))
}
これは平均を計算するノード(average ノード)を使った例です.3枚のデタラメなライトフレームを単純に加算平均してます.
これで位置合わせなしコンポジット機構もできましたので,位置合わせのいらない master dark や master flat をコンポジットするのはこのプログラムだけで完結できるということになります.やったー.
その3. リストへ変換
統計値計算をして得られるデータは二次元のデータです.各画素に,その位置の画素の統計値が入っています.ノイズ解析用 scatterplots ではこれらの統計値を横軸,縦軸の値として使用するため,一次元リストへ変換しておくと便利です.
ついでに常用対数を通した値にしておきます.
cake_transform!(
    "Convert 2d image to 1d list.",
    1, 0, 0,
    convert_to_1d_image<IOValue, IOErr>(image: Image) -> Image{
        vec![run_convert_to_1d(image)]
    }
),
cake_transform!(
    "Convert to log10",
    1, 0, 0,
    log10<IOValue, IOErr>(image: Image) -> Image {
        vec![run_log10(image)]
    }
),

fn run_convert_to_1d(image: &WcsArray) -> Result<IOValue, IOErr> {
    dim_is!(image, 2)?;
    let image_val = image.scalar();

    let list_size = *image_val.dim().as_array_view().first().unwrap();
    let mut list = Vec::with_capacity(list_size);
    for i in 0..list_size {
        for val in image_val.slice(s![i, ..]) {
            list.push(*val);
        }
    }
    Ok(IOValue::Image(
        image.make_slice(
            &[(2, 0.0, 1.0)],
            image
                .array()
                .with_new_value(Array1::from_vec(list).into_dyn()),
        ),
    ))
}

fn run_log10(image: &WcsArray) -> Result<IOValue, IOErr> {
    let mut out = image.clone();
    for v in out.scalar_mut().iter_mut() {
        *v = v.log10();
    }
    Ok(IOValue::Image(out))
}
その4. scatterplots の描画
これらの2つのリストから,scatterplots データを作っていきます.このプログラムでは様々な次元のデータを様々な形式で見られるようにしたいので,最終データには「タグ文字列」を付加するようにしています.今回の場合,形状が (2, データ数) の “scatter” タグがついた二次元データをscatterplots と解釈して描画することになります.
cake_transform!(
    "Create scatterplots from two 1D lists.",
    1, 0, 0,
    create_scatter<IOValue, IOErr>(xaxis: Image, yaxis: Image) -> Image{
        vec![run_create_scatter(xaxis, yaxis)]
    }
),

fn run_create_scatter(xaxis: &WcsArray, yaxis: &WcsArray) -> Result<IOValue, IOErr> {
    dim_is!(xaxis, 1)?;
    dim_is!(yaxis, 1)?;
    are_same_dim!(xaxis, yaxis)?;
    let image_val = xaxis.scalar();
    let width = image_val.len();
    let mut img = Vec::with_capacity(2 * width);
    for i in 0..width {
        for val in image_val.slice(s![i]) {
            img.push(*val);
        }
    }
    let image_val = yaxis.scalar();
    for i in 0..width {
        for val in image_val.slice(s![i]) {
            img.push(*val);
        }
    }
    let mut datapoints = Vec::new();
    for i in 0..width {
        datapoints.push((img[i], img[i + width]));
    }
    datapoints.sort_by(|a, b| a.partial_cmp(b).unwrap());
    let mut res = Vec::with_capacity(2 * width);
    for i in 0..width {
        res.push(datapoints[i].0);
    }
    for i in 0..width {
        res.push(datapoints[i].1);
    }
    let img = Array::from_shape_vec((2, width), res).unwrap();
    Ok(IOValue::Image(WcsArray::from_array_and_tag(
        Dimensioned::new(img.into_dyn(), Unit::None),
        Some(String::from("scatter")), //タグを付与するよ
    )))
}
うーん.コードが汚い.ここはなんとかしたいですね….
データポイントをとりあえずソートしています.これは描画を軽くするために必要なのですが,あとあとアルゴリズムを変えるかもしれません.
最後に scatterplots を描画してみます.ライブラリは implot を利用.
Some(tag) => match tag.as_ref() {
    "scatter" => match self.scalar().dim().ndim() { //タグを認識するよ
        2 => { //データは今のところ2次元に限定
            let state = &mut ctx.window.scatter_lineplot_state;
            let plot_ui = ctx.plotcontext.get_plot_ui();
            if let Err(e) = ui.scatter(
                &self.scalar2(),
                &plot_ui,
                Some(&AxisTransform::new("Median", "", |x| x)),
                Some(&AxisTransform::new("Standard Deviation", "", |y| y)),
                state,
            ) {
                ui.text(format!("Error on drawing plot! {}", e))
            }
        }
        _ => {
            ui.text(format!(
                "Unimplemented for scatter of dimension {}",
                self.scalar().ndim()
            ));
        }
    },
}

fn scatter<S, FX, FY>(
    &self,
    image: &ArrayBase<S, Ix2>,
    plot_ui: &PlotUi,
    xaxis: Option<&AxisTransform<FX>>,
    yaxis: Option<&AxisTransform<FY>>,
    state: &mut State,
) -> Result<(), Error>
where
    S: Data<Elem = f32>,
    FX: Fn(f32) -> f32,
    FY: Fn(f32) -> f32,
{
    let p = self.cursor_screen_pos();
    let window_pos = self.window_pos();
    let window_size = self.window_size();
    let size = [window_size[0], window_size[1] - (p[1] - window_pos[1])];
    state.simple_plot(self, image, &plot_ui, xaxis, yaxis, size)
}

pub(crate) fn simple_plot<S, FX, FY>(
    &mut self,
    ui: &Ui,
    image: &ArrayBase<S, Ix2>,
    plot_ui: &PlotUi,
    horizontal_axis: Option<&AxisTransform<FX>>,
    vertical_axis: Option<&AxisTransform<FY>>,
    size: [f32; 2],
) -> Result<(), Error>
where
    S: Data<Elem = f32>,
    FX: Fn(f32) -> f32,
    FY: Fn(f32) -> f32,
{
    let mut haxisname = "";
    let mut vaxisname = "";
    let mut haxisunit = "";
    let mut vaxisunit = "";
    if let Some(haxistrans) = horizontal_axis {
        haxisname = haxistrans.label();
        haxisunit = haxistrans.unit();
    }
    if let Some(vaxistrans) = vertical_axis {
        vaxisname = vaxistrans.label();
        vaxisunit = vaxistrans.unit();
    }
    let haxislabel = format!("{} ({})", haxisname, haxisunit);
    let vaxislabel = format!("{} ({})", vaxisname, vaxisunit);
    let size = [size[0] - 15.0, size[1] - 15.0];
    let xaxis = image.slice(s![0, ..]).to_vec();
    let yaxis = image.slice(s![1, ..]).to_vec();
    let mut datapoints = Vec::new();
    for i in 0..xaxis.len() {
        datapoints.push((xaxis[i], yaxis[i]));
    }
    let content_width = ui.window_content_region_width();
    let mut plot_limits: Option<ImPlotLimits> = None;

    Plot::new("Noise Analysis of Nikon D3, Median--Standard Deviation")
        .size(content_width, size[1])
        .x_label(&haxislabel)
        .y_label(&vaxislabel)
        .x_limits(&ImPlotRange { Min: 0.0, Max: 4.0 }, Condition::FirstUseEver)
        .y_limits(
            &ImPlotRange { Min: 0.0, Max: 3.0 },
            YAxisChoice::First,
            Condition::FirstUseEver,
        )
        .build(plot_ui, || {
            plot_limits = Some(get_plot_limits(None));
            let mut xaxis = Vec::new();
            let mut yaxis = Vec::new();
            if let Some(plot) = plot_limits {
                let (xmin, xmax, ymin, ymax) = (plot.X.Min, plot.X.Max, plot.Y.Min, plot.Y.Max);
                datapoints.retain(|&data| {
                    xmin <= data.0 as f64
                        && data.0 as f64 <= xmax
                        && ymin <= data.1 as f64
                        && data.1 as f64 <= ymax
                });
                let xstep = (xmax - xmin) / 50.0;
                let ystep = (ymax - ymin) / 50.0;
                datapoints.dedup_by(|a, b| {
                    (a.0 - b.0).abs() < xstep as f32 && (a.1 - b.1).abs() < ystep as f32
                });
                for datapoint in datapoints {
                    xaxis.push(datapoint.0 as f64);
                    yaxis.push(datapoint.1 as f64);
                }
            } else {
            }
            PlotScatter::new("data point").plot(&xaxis, &yaxis);
        });
    Ok(())
}ソートされているので,dedup関数で近い位置のデータを削除して描画点を減らしているわけですが,dedup関数の仕様上思惑通りにはいきません.この関数は連続する要素しか見ないので,y軸の値が近いのデータペアを見つけられないためです.ここは要改善です.
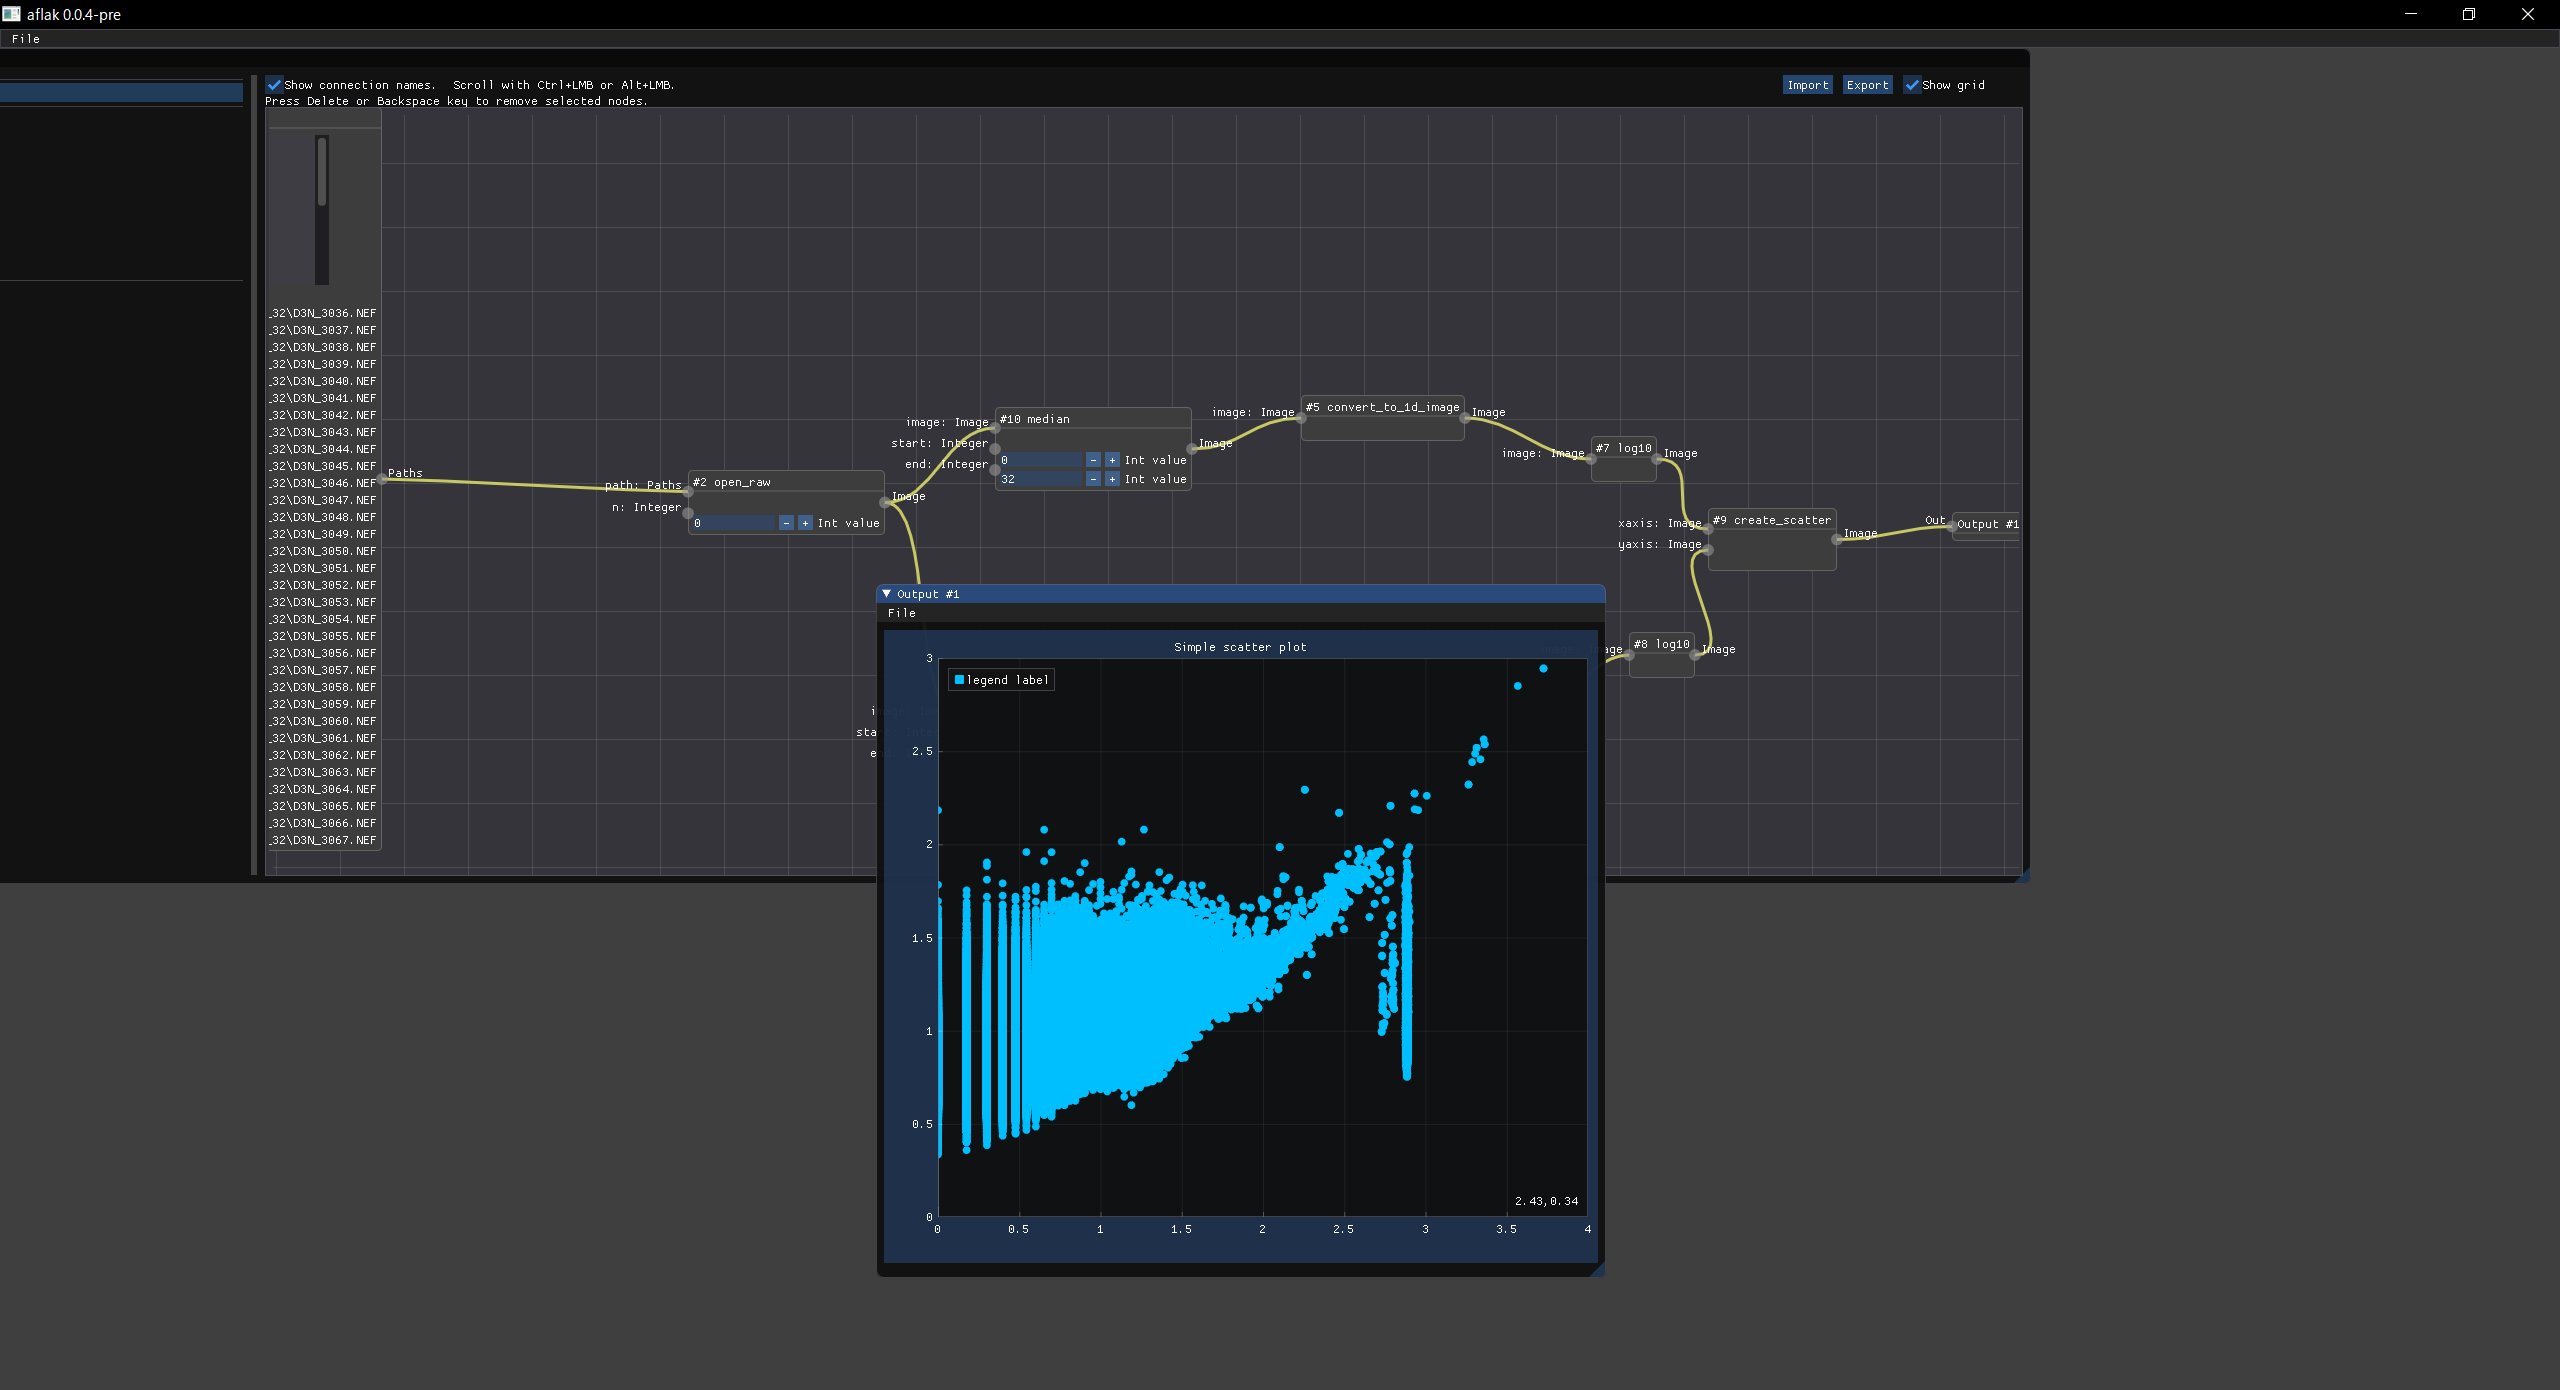
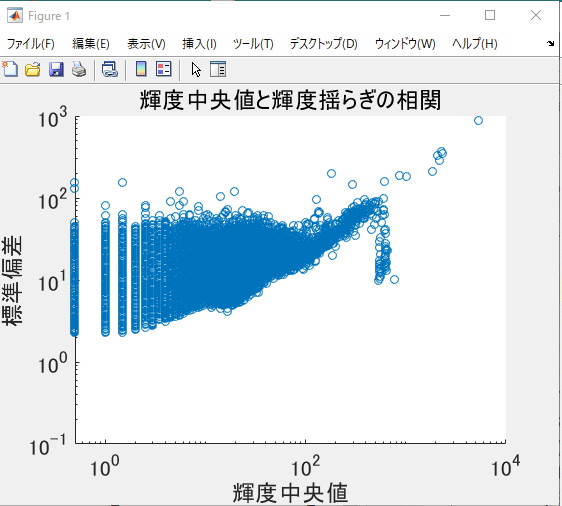
最終的には,こんな感じのデータが見られます. ↑今回得られた散布図.↓あぷらなーとさんの結果
ある程度インタラクティブに拡大したり,移動したりといった操作ができるビューアができましたので今はこれで良しとしておきます.やったぜ.
全体のビジュアルプログラムはこんな感じ.少し複雑(?)ですが,上に書いた流れをそのまま表現しているだけです.
例えばこのプログラムで「中央値画像を生成」の部分を「平均値画像を生成」するようなノードに変更すれば,横軸が平均値になったようなプロットを得たりといったことが誰でもコーディングなしでできるようになるわけです.どちらかの対数に変換するノードを消せば,片対数のプロットも作れたりします.以上!
おまけ. Fitsデータのカラー画像解釈
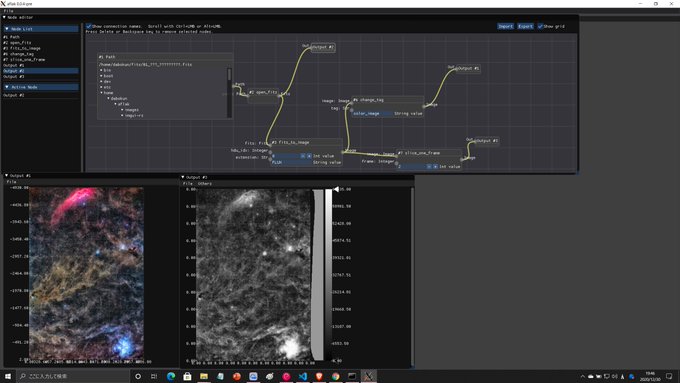
研究では輝度単一の値をカラーテーブルで変換することでしかデータを見てこなかったので,普通の天体画像のように3チャンネルあるような Fits データをカラー画像解釈できるようにしていきます.つまり,形状が (3, 画像横幅,画像縦幅) の “color_image” タグがついた三次元データをカラー画像と解釈して描画することになります.
チャンネル取り出しだけですが,ぐらすのすちさんも似たようなことをやっています.
Some(tag) => match tag.as_ref() {
    "color_image" => match self.scalar().dim().ndim() {
        3 => {
            /*省略*/
            if new_incoming_image {
                /*省略*/
                if let Err(e) = state.set_color_image(
                    image_ref,
                    ctx.created_on,
                    ctx.gl_ctx,
                    texture_id,
                    ctx.textures,
                ) {
                    ui.text(format!("Error on creating image! {}", e));
                }
            }
            if let Err(e) = ui.color_image(
                ctx.gl_ctx,
                ctx.textures,
                texture_id,
                unit,
                x_transform.as_ref(),
                y_transform.as_ref(),
                state,
            ) {
                ui.text(format!("Error on drawing image! {}", e));
            }
        }
        _ => {
            ui.text(format!(
                "Unimplemented for color image of dimension {}",
                self.scalar().ndim()
            ));
        }
    },
    _ => {
        ui.text(format!(
            "Unimplemented for visualization tag {}",
            self.scalar().ndim()
        ));
    }
},

//state.set_color_image()の中身
pub fn set_color_image<F>(
    &mut self,
    image: I,
    created_on: Instant,
    ctx: &F,
    texture_id: TextureId,
    textures: &mut Textures,
) -> Result<(), Error>
where
    F: Facade,
{
    self.image =
        image::Image::color_new(image, created_on, ctx, texture_id, textures, &self.lut)?;
    Ok(())
}

//image::Image::color_new()の中身
pub fn color_new<F>(
    image: I,
    created_on: Instant,
    ctx: &F,
    texture_id: TextureId,
    textures: &mut Textures,
    lut: &ColorLUT,
) -> Result<Image<I>, Error>
where
    F: Facade,
{
    let (vmin, vmax, tex_size, hist) = {
        let image = coerce_to_array_view3(&image);
        let vmin = lims::get_vmin(&image)?;
        let vmax = lims::get_vmax(&image)?;
        let raw = make_raw_image_rgb(&image, vmin, vmax, lut)?;
        let gl_texture = Texture2d::new(ctx, raw)?;
        let tex_size = gl_texture.dimensions();
        let tex_size = (tex_size.0 as f32, tex_size.1 as f32);
        textures.replace(
            texture_id,
            Texture {
                texture: Rc::new(gl_texture),
                sampler: SamplerBehavior {
                    ..Default::default()
                },
            },
        );
        let hist = hist::histogram_color(&image, vmin, vmax);
        (vmin, vmax, tex_size, hist)
    };

    Ok(Image {
        vmin,
        vmax,
        tex_size,
        created_on: Some(created_on),
        data: Some(image),
        hist,
    })
}

//make_raw_image_rgb()の中身
fn make_raw_image_rgb<S>(
    image: &ArrayBase<S, Ix3>,
    vmin: f32,
    vmax: f32,
    _lut: &ColorLUT,
) -> Result<RawImage2d<'static, u8>, Error>
where
    S: Data<Elem = f32>,
{
    let (_c, m, n) = image.dim();
    let mut data = Vec::with_capacity(3 * n * m);
    if !vmin.is_nan() && !vmax.is_nan() {
        for (_, slice) in image.axis_iter(Axis(1)).enumerate() {
            for (_, channel) in slice.axis_iter(Axis(1)).enumerate() {
                let r = channel[0] / 65535.0 * 255.0; //16bit -> 8bit
                let g = channel[1] / 65535.0 * 255.0;
                let b = channel[2] / 65535.0 * 255.0;
                data.push(r as u8);
                data.push(g as u8);
                data.push(b as u8);
            }
        }
        Ok(RawImage2d {
            data: Cow::Owned(data),
            width: n as u32,
            height: m as u32,
            format: ClientFormat::U8U8U8,
        })
    } else {
        Err(Error::Msg("vmin, vmax not set"))
    }
}
//===============================================================================================================

//最初のコードのui.color_image()の中身
fn color_image<F, FX, FY, I>(
    &self,
    _ctx: &F,
    _textures: &mut Textures,
    texture_id: TextureId,
    vunit: &str,
    xaxis: Option<&AxisTransform<FX>>,
    yaxis: Option<&AxisTransform<FY>>,
    state: &mut State<I>,
) -> Result<(), Error>
where
    F: Facade,
    FX: Fn(f32) -> f32,
    FY: Fn(f32) -> f32,
    I: Borrow<ArrayD<f32>>,
{
    let window_pos = self.window_pos();
    let cursor_pos = self.cursor_screen_pos();
    let window_size = self.window_size();
    const HIST_WIDTH: f32 = 40.0;
    const BAR_WIDTH: f32 = 20.0;
    const RIGHT_PADDING: f32 = 100.0;
    let image_max_size = (
        window_size[0] - HIST_WIDTH - BAR_WIDTH - RIGHT_PADDING,
        window_size[1] - (cursor_pos[1] - window_pos[1]),
    );
    let ([_p, _size], _x_label_height) =
        state.show_image(self, texture_id, vunit, xaxis, yaxis, image_max_size)?;
    Ok(())
}

//state.show_image()の中身
pub(crate) fn show_image<FX, FY>(
    &mut self,
    ui: &Ui,
    texture_id: TextureId,
    vunit: &str,
    xaxis: Option<&AxisTransform<FX>>,
    yaxis: Option<&AxisTransform<FY>>,
    max_size: (f32, f32),
) -> Result<([[f32; 2]; 2], f32), Error>
where
    FX: Fn(f32) -> f32,
    FY: Fn(f32) -> f32,
{
    /*省略*/
    ChildWindow::new(im_str!("scrolling_region"))
        .border(false)
        .scroll_bar(false)
        .movable(false)
        .scrollable(false)
        .horizontal_scrollbar(false)
        .build(ui, || {
            /*省略*/
            Image::new(texture_id, size).build(ui);
            /*1000行くらい省略…*/
        });
    /*省略*/
    Ok(([p, size], x_labels_height))
}
カラー画像がでました!めでたしめでたし.
おわりに
とりあえず三が日を使って Raw データ処理のスタートアップができました.今後は位置合わせコンポジットやコンポジット後の単一画像の画像処理など,PixInsight も導入したのでアルゴリズムを勉強しながら実装していく予定です.モジュールを分割して具体例と一緒に提供することで,僕以外の方にも使っていただけるようなものが作れたらいいなあと思っています.また何か成果が出たら記事にしたいと思います.
それでは.